CHaMP Technical Details
Observation window
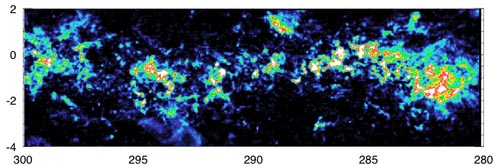
A 20° section of the Galactic Plane, 300° > l > 280°
Latitude spread -4° < b < +2°
Total area = 120 sq.deg.
3mm Observations
Nanten coverage
Telescope: 4m diameter dish, beam FWHM 2.6 arcmin at 100 GHzMaps as below with 2 arcmin pixels:
- 12CO line at 115.271 GHz, velocity coverage -60 to +40 km/s, 0.1 km/s channels
- 13CO line at 110.301 GHz, velocity coverage -60 to +40 km/s, 0.1 km/s channels
- C18O line at 109.781 GHz, velocity coverage -60 to +40 km/s, 0.1 km/s channels
- HCO+ line at 89.189 GHz, velocity coverage -60 to +40 km/s, 0.1 km/s channels
Identified 209 massive dense molecular clumps within GMCs from C18O and HCO+ maps, suitable for Mopra follow-up
Mopra coverage

Click the above map for a larger view, with corresponding region numbers as
referenced in CHaMP Paper I.
Telescope: 22m diameter dish, beam FWHM 36" at 85-100 GHz (Ladd et al 2005).
Receiver: 3mm MMIC covering 75-116 GHz, Tsys < 200 K below 100 GHz in good weather.
On-the-fly (OTF) mapping with super-Nyquist sampling (12" pixels after gridding) over square maps
(typically a few arcmin across), rastering in RA, Dec, l, or b.
Ta*(rms) < 0.3 K per 0.1 km/s channel after 2 orthogonally-rastered OTF maps in good weather.
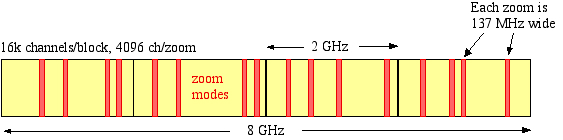
MOPS digital filterbank
Bandwidth: 8 GHz instantaneous, comprised of four 2 GHz blocks, with up to 128k spectral channels.Zoom mode: up to 4 in each block (16 total), each with 137 MHz bandwidth in 4096 channels × 2 polarisations, giving ~0.1 km/s spectral resolution (see schematic diagram).
2006 & 2007 spectral coverage
For these seasons we mapped 121 Nanten clumps at 85-93 GHz, including the following spectral lines (grouped by zoom mode):- SiO maser line at 86.243 GHz
- H13CN line at 86.342 GHz
- H13CO+, HCO, SiO lines at ~86.8 GHz
- HCN line at 88.632 GHz
- HCO+ line at 89.189 GHz
- CH3CN line at 91.97 GHz
- N2H+ line at 93.173 GHz
The first Data Release (DR1) is described in CHaMP Paper I (Barnes et al. 2011; see Papers & Posters). Full data cubes, moment maps and data tables are accessible for download here.
2009 - 2012 spectral coverage
In these seasons we additionally mapped the same clumps at 107-115 GHz, in the following spectral lines:
- CH3OH line at 108.89 GHz
- HC3N line at 109.17 GHz
- SO line at 109.25 GHz
- OCS line at 109.46 GHz
- C18O line at 109.78 GHz
- 13CO line at 110.20 GHZ
- C17O line at 112.36 GHz
- CN lines at 113.2–113.5 GHz
- CO line at 115.27 GHz
The 12CO data are described in CHaMP Paper III (Barnes et al. 2016; see Papers & Posters), and available for download in DR3.
The 13CO and C18O data are further described in CHaMP Paper IV (Barnes et al. 2018; see Papers & Posters), and available for download in DR4.
1mm Observations
ASTE imaging – External Link ASTE –
AzTEC bolometer camera map of a 5°×1° strip across the η Carinae GMCIR Observations
AAT imaging – External Link AAT –
- H2 v=1-0 S(1) line at 2.122 μm
- H2 v=2-1 S(1) line at 2.249 μm
- Brackett-γ line at 2.166 μm
- K-continuum filter covering a "line-free" band from 2.25-2.29 μm
Service Time
IRIS2 camera with 8 arcmin field in K band (2.2 μm), using multiple narrowband filters for wide-field imaging of a pilot sample of 5 molecular clumps during 2006-07:
Full Survey
Observations made in 2011 and 2012 of 146/303 of the Mopra clumps, in the above narrowband filters plus broadband J, H, K filters.
First results of this IR work are described in CHaMP Paper I.5 (Barnes et al 2013; see Papers & Posters),
and available for download in DR2. Further data analysis continues.
Gemini South – External Link Gemini South –
Multiband mid-IR imaging of BYF 73 using the T-ReCS camera from observations in 2010 are described by Pitts et al 2018 (see Papers & Posters).
CTIO – External Link CTIO –
Using the NEWFIRM camera on the Blanco 4m, J, H, Ks imaging of the remaining Mopra clumps was obtained in 2011 and 2012. Data analysis is underway.
VLT – External Link VLT –
Very deep J, H, Ks photometry and astrometry of BYF 73 with HAWK-I was obtained in 2011, and results are described by Andersen et al 2017 (Papers & Posters).
Spitzer Space Telescope – External Link SST –
GO Program 80024 awarded 73.5 hours for Cycle 8 in 2012 for deep imaging of 209 Nanten clumps in IRAC bands 1 and 2.
...(More details forthcoming)...